
One cloud that watches your entire landscape.
OPS4 is a cloud platform that continuously monitors servers, databases, SAP applications and hypervisors. Your servers connect outward to OPS4, so there are no inbound firewall holes, VPN tunnels or open ports. Install, approve, and you have visibility.
Your own cloud instance in Europe. Install the agent, approve the host, and your first servers are on screen within half an hour.
How it works
OPS4 runs as a cloud instance. A lightweight agent on each server reaches out to OPS4 (heartbeat → commands → results). Traffic is always outbound over HTTPS, isolated per tenant with a key and an IP allowlist. OPS4 never opens a connection into your network.
OPS4 Cloud
Collects, evaluates thresholds, dashboards & alerting. Isolated per tenant.
● Your own instanceWhat OPS4 monitors
From the operating system deep into your SAP stack, every database, your hypervisors and the public cloud, all in one overview, with automatic per-plugin check assignment and self-healing that disables faulty checks per host.
Linux & Windows
- CPU, memory, disks
- Services & processes
- Ports & uptime
- Lightweight agent, auto-update
HANA, MSSQL & more
- Availability & memory
- Disks, backups, license
- Blocked / long-running tx
- Read-only monitoring user
SAP S/4HANA · ABAP
- Work processes & locks
- Syslog, spool, updates
- Certificates & license
- Native ABAP plugin
Proxmox & VMware
- Cluster quorum & nodes
- VM/LXC status & resources
- Storage & backups
- Agent on the hypervisor
Plus agentless cloud monitoring for SAP BTP and Microsoft Azure. OPS4 polls those itself, no agent required. See everything we monitor →
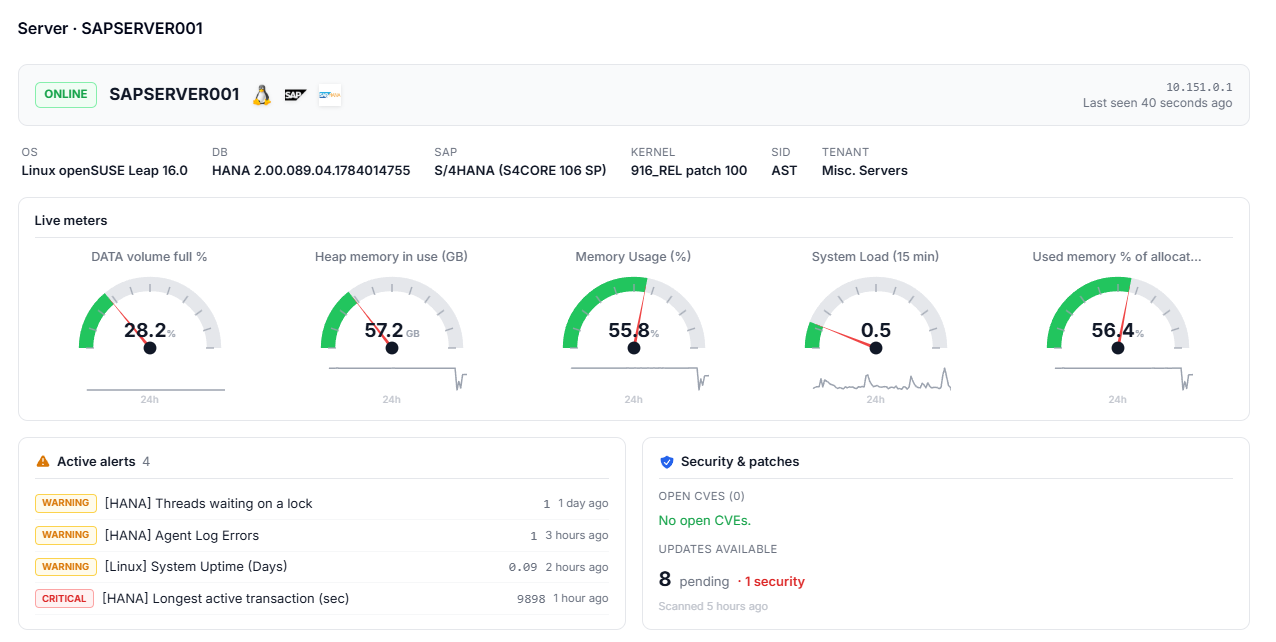
One screen per server, everything at a glance
Status and key facts up top: operating system, database, SAP release, kernel and tenant. Below them the meters you picked yourself, each with its run over the past 24 hours, the open alerts with value and age, and that server’s patch and CVE standing. Drilling into the trend over a month or a year, acknowledging, scheduling maintenance or testing an alert all happen from the same screen.
More than just watching
OPS4 also acts, reaches shielded servers, and makes sure the right alert reaches the right person.
Work that does itself
Ready-made automations the agent carries out safely, step by step: from SAP kernel and HANA revision updates to OS release upgrades.
- SAP kernel & HANA revision updates
- OS patching & release upgrades
- Profile parameters, certificates & client copies
- Approval step, backup check, snapshot & rollback
Reach what is shielded
An OPS4 Worker appliance on the LAN relays traffic for servers without internet, and monitors network devices without an agent.
- Air-gapped servers in OPS4 anyway
- Agentless via SNMP v2c/v3 · SSH · HTTPS
- Network discovery & iLO/iDRAC hardware health
- Syslog collector for network devices
The right alert, the right person
- Per method: warning / critical / host-down
- A ticket in Jira or TOPdesk, a message in Teams or Telegram
- Phone escalation: an unanswered call rings the next person
- One message per outage, not fifty: dependencies and flapping are recognised
Thought through to the last detail
AI built in
AI writes your Service Level Reports, pre-checks automation jobs, and helps interpret findings across the estate.
Updates from OPS4
OPS4 checks every server for available OS & security updates and rolls them out from one place, staged, approved, with rollback.
CVE vulnerability view
Known CVEs affecting your installed packages are surfaced per host, so you see exactly what is exposed and where.
AI Service Level Reports
A professional PDF report per server: numbers from the data, prose by AI, in NL or EN.
Maintenance windows
Timed maintenance (1h–1w or until-off) with engineer & reason; alerts are muted.
Self-healing checks
A check that fails on a host disables itself there. No false alarms, no noise.
Auto-provisioning
An approved host automatically gets all the right checks for its plugin. Nothing wired by hand.
Live dashboards
Servers, Workers and Cloud Connections in one tree, with trends, status and deep links.
Jira & TOPdesk
An outage opens a ticket in the service desk you already work in, and closes it when the check recovers. Repeat alerts are attached to the ticket that is already open.
Public status page
Your business services, ninety days of history and planned maintenance on a page without a login. Subscribers get a mail when a service goes down and when it is back.
Downtime budget
Per business service the SLA target as minutes of downtime this month, spent and left, plus a weekly digest of what is red and what is filling up.
Capacity alerts
Days until a disk, volume or memory reaches its threshold, forecast daily. You hear it weeks ahead, not when it is full.
CMDB & CI sheet
Relations, configuration history and hardware per server on one A4 sheet. An unplanned change stands out; an outage names what depends on it.
SAP System Health Report
An EarlyWatch-style health report without Solution Manager: workload, buffers and memory, database growth.
ISO 27001 evidence
A tamper-evident audit trail, a write-once log archive, backup evidence and access logs, brought together in a compliance chapter of the service report.
AI assistant
Ask OPS4 in your own words how something works and where to find it, right inside the product.
Wallboard & phone app
A television pairs with a code and shows what is red. The phone app shows the red list and acknowledges with an end time.
Events & read API
Backup jobs and pipelines report their outcome as a check; a read-only API and Prometheus metrics feed your own dashboards.
Why OPS4
Plenty of tools draw a graph. These four are the reasons people pick OPS4.
SAP, all the way down
Maintenance dates from SAP’s own PAM, HotNews per system, STRUST certificates and kernel updates. Not generic monitoring with an SAP plugin bolted on.
It fixes things itself
Ready-made automations and Automatic Healing, usable on day one. No scripts for you to write and then keep maintaining.
Your own instance in Europe
No shared SaaS and no data outside the EU. One environment per customer, with an immutable audit log.
Nothing open inbound
All traffic is outbound. No inbound ports, no VPN tunnel, and so no argument with your security officer.
See it on your own landscape, not on a demo environment
Request a demo and we set up your own cloud instance in Europe for you. Install the agent, approve the host, and your first servers are on screen within half an hour. Without opening your firewall.
OPS4 · Monitoring · Automation · Notifications.